 PickVids
Best Data visualization & information design Videos
The 53 Data visualization & information design videos here were recommended by different people across different months. Choose by who it is for: 1 introductory, 8 intermediate, 44 for a general viewer, and 0 for someone who wants the harder derivation. Most of them are a talk. What they share is that one speaker finishes a claim, and the examples exist to hold that claim up. Channels you will keep seeing include TED, Colin McDonnell, Enthought.
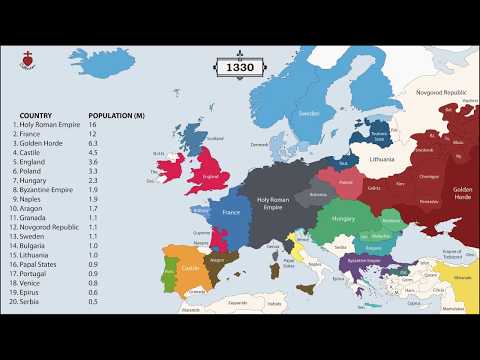
The History of Europe: Every Year
An animated map showing the borders and populations of European countries for every year since 400 BC.

The Tube Map nearly looked very different
Map Men's Jay Foreman tells the story of how the London Tube map nearly looked very different, including Harry Beck's design and TfL's initial rejection of it.

✖️Coronavirus TIMELINE
A data-visualization style timeline of the early coronavirus outbreak events by YouTuber Nathan Rich.

Gabbard Diagram for Low Earth Orbit 1959-2021
An animated Gabbard diagram of objects in low Earth orbit from 1959 to 2021, showing altitude over time.

China - 3,000 Years of History in a Minute
An animated map of the territories of Chinese dynasties from 1000 BC to the present, compressed into about a minute.