 PickVids
Best Data visualization & information design Videos
「Data visualization & information design」下面有53部被不同的人、在不同月份推荐过的视频。挑的时候先看对象:入门1部,适合还没学过的人;进阶8部,适合已经懂术语的人;普通向44部,按兴趣就能看;更硬的0部,留给想看推导或细节的人。这一类数量最多的是演讲,所以它们的共同点是一位讲者把一个判断讲完,例子是为了撑住这个判断。常出现的频道包括TED、Colin McDonnell、Enthought。目录给这个主题划的范围是:Data visualization: charts, maps, infographics, Edward Tufte, Hans Rosling, interactive visualization, D3, time-lapse data art, visual explanations of data.如果只看三部,就从《A Better Default Colormap for Matplotlib | SciPy 2015 | Nathaniel Smith and Stéfan van der Walt》开始,它负责把问题讲出画面;然后看《Hans Rosling's 200 Countries, 200 Years, 4 Minutes - The Joy of Stats - BBC》,换一种讲法或例子;最后看《DON'T PANIC — Hans Rosling showing the facts about population》,留给已经有基础的人。页面按每页24部切开,顺序看的是被推荐跨越了多少个月,不是播放量。每条标题下面那一句是这部片子自己的内容说明,用来区分它在讲定义、过程、演示还是观点。点进去能看到推荐原话、原文链接和适合谁看。看的时候把强烈推荐当成有人明确叫你去看,把引用当成只是拿来举例,把批评留下来对照,不要把每条评论都当成同一力度。
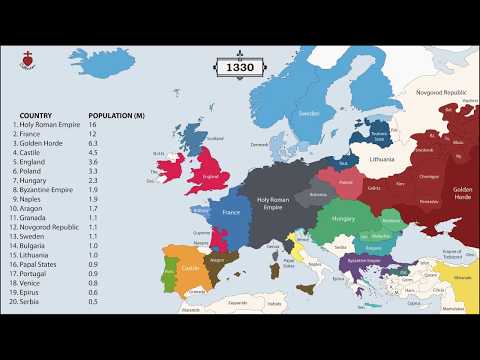
The History of Europe: Every Year
An animated map showing the borders and populations of European countries for every year since 400 BC.

The Tube Map nearly looked very different
Map Men's Jay Foreman tells the story of how the London Tube map nearly looked very different, including Harry Beck's design and TfL's initial rejection of it.

✖️Coronavirus TIMELINE
A data-visualization style timeline of the early coronavirus outbreak events by YouTuber Nathan Rich.

Gabbard Diagram for Low Earth Orbit 1959-2021
An animated Gabbard diagram of objects in low Earth orbit from 1959 to 2021, showing altitude over time.

China - 3,000 Years of History in a Minute
An animated map of the territories of Chinese dynasties from 1000 BC to the present, compressed into about a minute.