 PickVids
Best Data visualization & information design Videos
「Data visualization & information design」下面有53部被不同的人、在不同月份推荐过的视频。挑的时候先看对象:入门1部,适合还没学过的人;进阶8部,适合已经懂术语的人;普通向44部,按兴趣就能看;更硬的0部,留给想看推导或细节的人。这一类数量最多的是演讲,所以它们的共同点是一位讲者把一个判断讲完,例子是为了撑住这个判断。常出现的频道包括TED、Colin McDonnell、Enthought。目录给这个主题划的范围是:Data visualization: charts, maps, infographics, Edward Tufte, Hans Rosling, interactive visualization, D3, time-lapse data art, visual explanations of data.如果只看三部,就从《A Better Default Colormap for Matplotlib | SciPy 2015 | Nathaniel Smith and Stéfan van der Walt》开始,它负责把问题讲出画面;然后看《Hans Rosling's 200 Countries, 200 Years, 4 Minutes - The Joy of Stats - BBC》,换一种讲法或例子;最后看《DON'T PANIC — Hans Rosling showing the facts about population》,留给已经有基础的人。页面按每页24部切开,顺序看的是被推荐跨越了多少个月,不是播放量。每条标题下面那一句是这部片子自己的内容说明,用来区分它在讲定义、过程、演示还是观点。点进去能看到推荐原话、原文链接和适合谁看。看的时候把强烈推荐当成有人明确叫你去看,把引用当成只是拿来举例,把批评留下来对照,不要把每条评论都当成同一力度。

Why are we changing maps? (from The West Wing)
A short clip from The West Wing in which staffers meet a group advocating the Peters projection and challenge the Mercator map.

BahnMining - Pünktlichkeit ist eine Zier (David Kriesel)
David Kriesel's 36C3 talk, in German, analyzes a year of scraped data on every stop of every long-distance train in Germany.

Sonification & The Problem with Making Music from Data
Tantacrul examines sonification, the practice of turning data into sound or music, and critiques how scientists and musicians, including NASA and CERN projects, use it well and poorly.
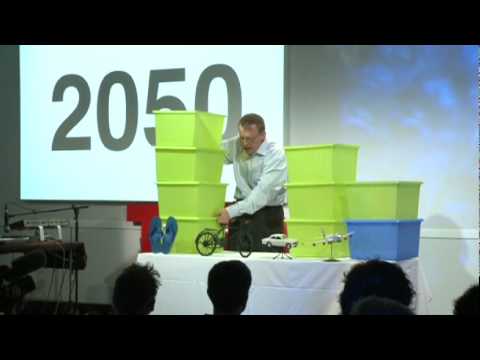
Hans Rosling: Global population growth, box by box
Hans Rosling's TED@Cannes talk uses boxes and animated data graphics to show how world population will grow to about 9 billion.

The Hubble Ultra Deep Field in 3D
A short video built around an animation of the roughly 10,000 galaxies in the Hubble Ultra Deep Field, placed at their measured redshift distances.

Gall--Peters Projection
A short clip from The West Wing in which characters argue for the Gall-Peters map projection over Mercator.
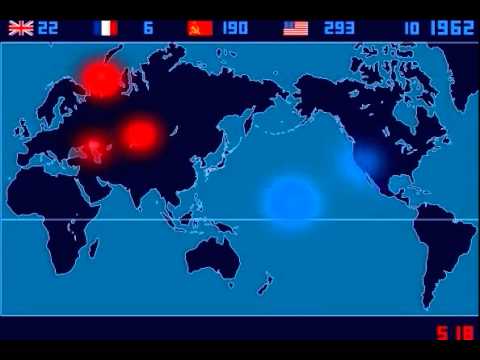
A Time-Lapse Map of Every Nuclear Explosion Since 1945 - by Isao Hashimoto
Isao Hashimoto's time-lapse map shows all 2053 nuclear explosions between 1945 and 1998, with each nation getting a blip and a running tally.

Drawing Conclusions: Is renting really a waste of money?
A short Globe and Mail animated explainer on why renting can leave you as well off as buying a home.

violin plots should not exist
Physicist Angela Collier rants for 42 minutes about why violin plots are a poor way to show data, citing papers on violin and bean plots.

Google Earth’s Incredible 3D Imagery, Explained
A short explainer from Nat and Friends on where Google Earth's 3D imagery comes from, how it is stitched together, and how often it is updated.

See how the rest of the world lives, organized by income | Anna Rosling Rönnlund
Anna Rosling Rönnlund presents Dollar Street, a project photographing homes in dozens of countries, from stoves to beds to toilets, and sorting them by income.

Is the world getting better or worse? A look at the numbers | Steven Pinker
Steven Pinker's TED talk presents data on homicide, war, poverty and pollution to argue that the world has improved over the past decades.

Reddit Place (/r/place) - FULL 72h (90fps) TIMELAPSE
A 72-hour timelapse of Reddit's 2017 April Fools' experiment r/place, a collaborative pixel canvas where each user could place one pixel every few minutes.
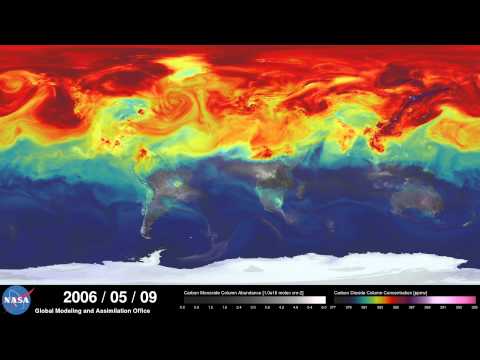
NASA | A Year in the Life of Earth's CO2
A short NASA Goddard visualization from the GEOS-5 model showing a year of atmospheric carbon dioxide moving around the globe.
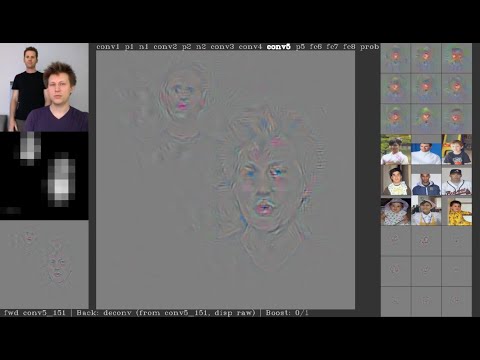
Deep Visualization Toolbox
A short demo of the Deep Visualization Toolbox, which shows the activations inside a convolutional neural network as it processes live camera input.

Visualizing Data Using t-SNE
A Google Tech Talk by Laurens van der Maaten, co-creator of t-SNE, on visualizing high-dimensional data by mapping it to two dimensions.

High Res Wifi Signal Mapping
CNLohr maps Wi-Fi signal strength at high resolution by moving an ESP8266 on a CNC mill, then visualizes the 3D data in WebGL.

H3: Tiling the Earth with Hexagons
Uber Engineering's Joseph Gilley explains why Uber uses hexagons for geospatial indexing and introduces H3, its open source hierarchical grid system.

To Scale: THE SOLAR SYSTEM
A short film in which friends build the first true-to-scale model of the solar system, with full planetary orbits, on a Nevada dry lakebed.

800+ days of Minecraft in 8 minutes
A Gource visualization of 826 days of Minecraft development, from alpha 1.2 to release 1.5, condensed into eight minutes.

Asteroid Discovery - 1970-2015 - 8K resolution
Scott Manley's short animation shows every asteroid discovery from 1970 to 2015 plotted over time in 8K.

The magic washing machine | Hans Rosling
Hans Rosling makes the case that the washing machine was the greatest invention of the industrial revolution.

Nuclear Detonation Timeline "1945-1998"
A timeline visualization plotting the 2053 nuclear tests and detonations from 1945 to 1998 on a world map, with sound marking each blast.

Most Popular Programming Languages 1965 - 2019
An animated ranking of the most popular programming languages from 1965 to 2019, built from popularity indexes, GitHub access data and historical surveys.