 PickVids
Best Data science & statistics Videos
「Data science & statistics」下面有56部被不同的人、在不同月份推荐过的视频。挑的时候先看对象:入门9部,适合还没学过的人;进阶12部,适合已经懂术语的人;普通向32部,按兴趣就能看;更硬的3部,留给想看推导或细节的人。这一类数量最多的是演讲,所以它们的共同点是一位讲者把一个判断讲完,例子是为了撑住这个判断。常出现的频道包括Veritasium、Enthought、Stand-up Maths。目录给这个主题划的范围是:Data science and applied statistics: data analysis, pandas, scientific Python, regression, A/B testing, causal inference, Bayesian methods, statistical misconceptions, big data, data engineering.如果只看三部,就从《A Better Default Colormap for Matplotlib | SciPy 2015 | Nathaniel Smith and Stéfan van der Walt》开始,它负责把问题讲出画面;然后看《DON'T PANIC — Hans Rosling showing the facts about population》,换一种讲法或例子;最后看《Is Most Published Research Wrong?》,留给已经有基础的人。页面按每页24部切开,顺序看的是被推荐跨越了多少个月,不是播放量。每条标题下面那一句是这部片子自己的内容说明,用来区分它在讲定义、过程、演示还是观点。点进去能看到推荐原话、原文链接和适合谁看。看的时候把强烈推荐当成有人明确叫你去看,把引用当成只是拿来举例,把批评留下来对照,不要把每条评论都当成同一力度。

Travis Oliphant: NumPy, SciPy, Anaconda, Python & Scientific Programming | Lex Fridman Podcast #224
Lex Fridman interviews Travis Oliphant, creator of NumPy, SciPy and Anaconda, about scientific Python and its history.

The Power of Big Data and Psychographics | 2016 Concordia Annual Summit
Alexander Nix of Cambridge Analytica presents at the 2016 Concordia Summit on using big data, psychographic profiling and behavioral microtargeting in elections.

Google Developers Day US - Theorizing from Data
Peter Norvig's 2007 Google talk on theorizing from data, covering what huge datasets can do for language understanding, translation, information extraction and inference.

Efficient Bayesian inference with Hamiltonian Monte Carlo -- Michael Betancourt (Part 1)
Michael Betancourt's lecture at MLSS Iceland 2014 on efficient Bayesian inference with Hamiltonian Monte Carlo.

Peter Norvig - The Unreasonable Effectiveness of Data
Peter Norvig's UBC distinguished lecture on how massive amounts of simple data, such as for language modeling, can yield understanding that hand-built models could not.

You've (Likely) Been Playing The Game Of Life Wrong
Veritasium explains why many real-world systems follow power laws rather than normal distributions.

Making R run Fast - Jan Vitek
Jan Vitek of Northeastern University gives a meetup talk on the challenges of making the R language run fast.

Jake Vanderplas - Statistics for Hackers - PyCon 2016.mp4
Jake Vanderplas's PyCon 2016 talk shows how sampling-based methods such as simulation, shuffling and bootstrapping make statistics intuitive.

Dance p 3 Mar09
Geoff Cumming uses a simulation to show how wildly the p value varies from one replication to the next because of sampling variability.

Introduction to Julia - Part 1 | SciPy 2014 | David Sanders
David Sanders gives the first part of a two-part introduction to the Julia programming language at SciPy 2014.

BahnMining - Pünktlichkeit ist eine Zier (David Kriesel)
David Kriesel's 36C3 talk, in German, analyzes a year of scraped data on every stop of every long-distance train in Germany.

Bringing the Unix Philosophy to Big Data by Bryan Cantrill: FutureStack13
Bryan Cantrill presents Manta, an object store with in-situ compute that lets tools like grep, awk, and sed run map-reduce style over huge data.

Cambridge Ideas - Professor Risk
David Spiegelhalter, Professor of the Public Understanding of Risk, uses statistics to weigh everyday risks such as bacon sandwiches and cycling.
What is the best diet for humans? | Eran Segal | TEDxRuppin
Prof.

Naive empiricism, terrorism & Ebola.
Nassim Taleb argues that evidence on terrorism risk presented in media is statistically naive, using extreme value theory without math to separate fat-tailed risks like Ebola and terrorism from thin-tailed ones.

The 100 Year Flood Is Not What You Think It Is (Maybe)
Practical Engineering explains what a 100-year flood actually means, combining statistics, hydrology and how society treats risk.
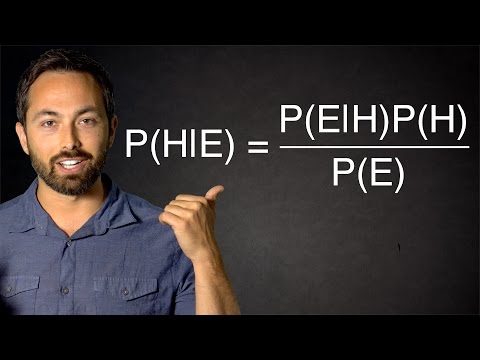
The Bayesian Trap
Veritasium explains Bayes' theorem with examples and introduces the 'Bayesian trap', where repeated events get mistaken for inevitable ones.

violin plots should not exist
Physicist Angela Collier rants for 42 minutes about why violin plots are a poor way to show data, citing papers on violin and bean plots.

Do these scatter plots reveal fraudulent vote-switching in Michigan?
Matt Parker of Stand-up Maths examines scatter plots that were claimed to show fraudulent vote-switching in Michigan's 2020 election.

Why do Biden's votes not follow Benford's Law?
Matt Parker examines claims that Biden's 2020 vote counts violate Benford's Law, explaining the law and why it often does not apply to precinct-level election data.

Protecting Privacy with MATH (Collab with the Census)
minutephysics, in collaboration with the US Census Bureau, explains differential privacy and why the 2020 census adds noise to protect individuals' data.

Clutching at Random Straws, Matt Parker | LMS Popular Lectures 2010
Matt Parker's LMS popular lecture on how seemingly incredible results can be meaningless random patterns.

Jonathan Diegelman - Modeling Spacecraft Separation Dynamics in Julia
A JuliaCon talk by a NASA Launch Services Program engineer on modeling spacecraft separation dynamics in Julia.

Foundry 2022 Operating System Demo
A 49-minute demo of Palantir Foundry by its chief architect.